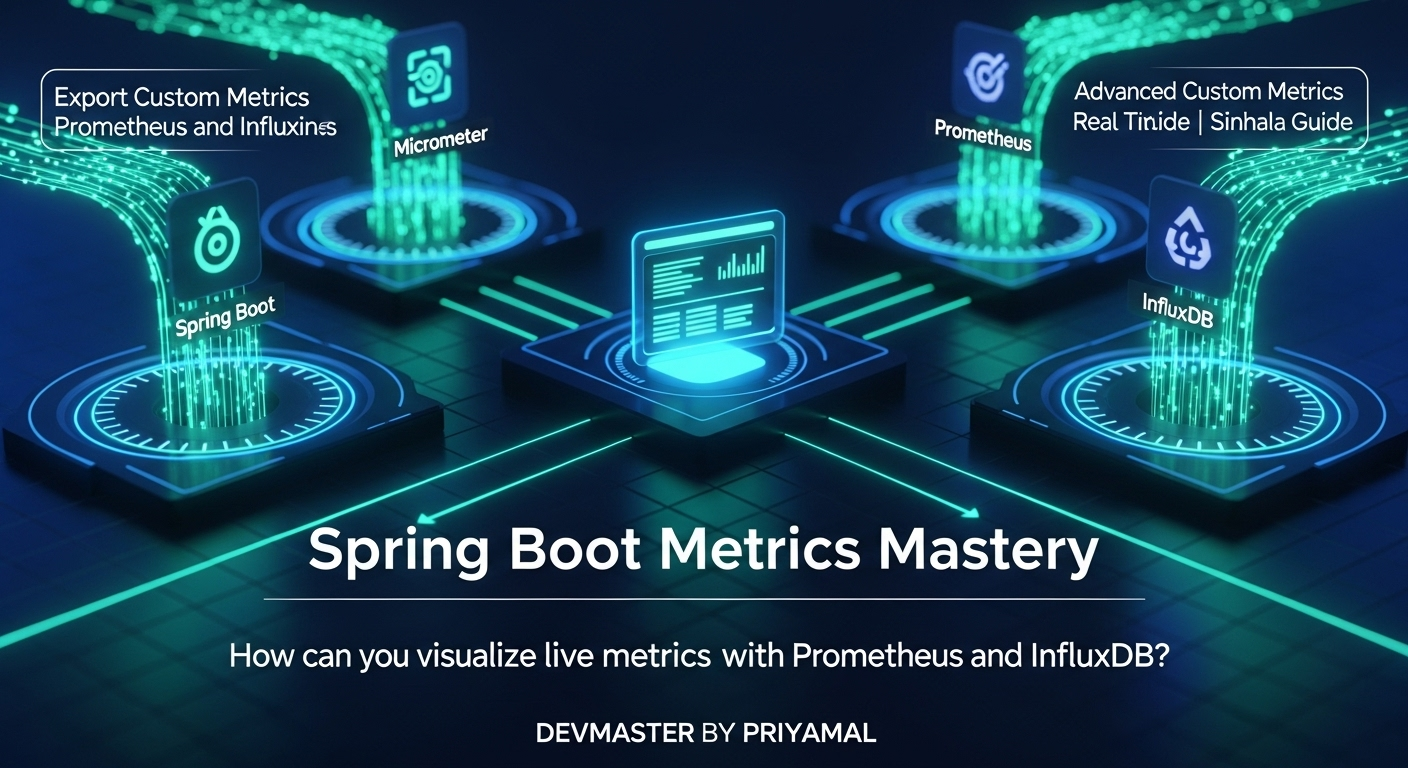
Spring Boot Micrometer Metrics: Prometheus & InfluxDB - සිංහල Guide
හැඳින්වීම: Micrometer සමඟ ඔබේ Spring Boot යෙදුම්වල නිරීක්ෂණ බලය වැඩි දියුණු කිරීම!
කොහොමද යාලුවනේ! අද අපි කතා කරන්න යන්නේ ඔයාලගේ Spring Boot applications නිරීක්ෂණය කරන එක ඊළඟ මට්ටමට ගෙනියන විදිය ගැන. විශේෂයෙන්ම, Micrometer කියන Library එක පාවිච්චි කරලා, ඔබේ applications වලින් metrics (තොරතුරු) එකතු කරලා, ඒව Prometheus සහ InfluxDB වගේ monitoring systems කිහිපයකට එකවර යවන හැටි ගැන. මේක ඇත්තටම ගොඩක් වැදගත්, මොකද හොඳ monitoring නැතුව අපිට application එකක ප්රශ්නයක් ආවම හොයාගන්න අමාරුයි නේද?
අපි දන්නවා අපේ application එකක CPU usage එක කොහොමද, memory usage එක කොහොමද, එක request එකක් ගන්න වෙලාව කොච්චරද වගේ දේවල් නිරීක්ෂණය කරන එක අත්යවශ්යයි කියලා. Micrometer කියන්නේ Spring Boot වලට මේ metrics manage කරන්න තියෙන standard interface එකක්. මේක අපිට පුළුවන් එක තැනක ලියපු metrics, අවශ්ය වෙලාවට විවිධ monitoring systems වලට (backends) export කරන්න. අද අපි බලමු කොහොමද Prometheus වගේ pull-based system එකකට වගේම, InfluxDB වගේ push-based system එකකටත් metrics යවන්නේ කියලා.
මේ tutorial එක අවසානෙදි, ඔයාලට පුළුවන් වෙයි Spring Boot application එකක custom metrics එකතු කරලා, ඒව එකවර Prometheus සහ InfluxDB දෙකේම දකින්න. එහෙනම්, අපි පටන් ගමු!
1. Micrometer සහ Metrics වල වැදගත්කම
මුලින්ම බලමු මොනවද මේ metrics කියන්නේ සහ Micrometer මේකට උදව් කරන්නේ කොහොමද කියලා.
Metrics කියන්නේ මොනවද?
සරලව කිව්වොත්, metrics කියන්නේ අපේ application එකේ performance, health, සහ behavior එක ගැන සංඛ්යාත්මක දත්ත (numerical data) තොරතුරු. උදාහරණයක් විදියට:
- API calls ගණන: එක විනාඩියකට API එකකට එන calls කීයක්ද?
- Request Latency: එක request එකක් process කරන්න කොච්චර වෙලාවක් යනවද?
- Error Rate: වැරදි (errors) කීයක් එනවද?
- JVM Memory Usage: Java Virtual Machine එක කොච්චර memory පාවිච්චි කරනවද?
මේ වගේ දේවල් නිරීක්ෂණය කිරීමෙන් අපිට පුළුවන් application එකක ගැටලුවක් ඇතිවෙන්න කලින් හඳුනාගන්න, නැත්නම් ගැටලුවක් ආවම ඉක්මනින්ම ඒක විසඳගන්න. Imagine කරන්න, ඔයාගේ application එක සෑහෙන්න Slow වෙලා. Monitoring නැත්නම් කොහෙන්ද බලන්න පටන් ගන්නේ කියලා හිතාගන්නවත් බැහැ නේද?
Micrometer ඇයි වැදගත්?
Micrometer කියන්නේ metrics collect කරන්න තියෙන විවිධ frameworks (උදා: Prometheus, InfluxDB, New Relic, Datadog) සඳහා තියෙන facade (interface) එකක්. මේකේ ලොකුම වාසිය තමයි, ඔයාගේ code එකේ metrics collect කරන්න එකම API එකක් පාවිච්චි කරලා, පස්සේ application එකේ configuration එක විතරක් වෙනස් කරලා ඕනෑම monitoring system එකකට metrics යවන්න පුළුවන් වීම.
මීට කලින්, ඔයාට Prometheus වලට metrics යවන්න වෙන library එකක්, InfluxDB වලට යවන්න තව library එකක් වගේ දෙක තුනක් පාවිච්චි කරන්න වෙනවා. Micrometer නිසා ඒ කරදරේ නැහැ! අපිට පුළුවන් එකම MeterRegistry එකක් පාවිච්චි කරලා, විවිධ MeterRegistry implementations (e.g., PrometheusMeterRegistry, InfluxMeterRegistry) හරහා metrics යවන්න.
2. Spring Boot Project එකක් Set Up කරමු
හරි, දැන් අපි පටන් ගමු අලුත් Spring Boot project එකක් හදලා අවශ්ය dependencies එකතු කරන හැටි.
මුලින්ම Spring Initializr එකට ගිහින් අලුත් project එකක් හදාගන්න. මේ dependencies ටික එකතු කරන්න:
- Spring Web
- Spring Boot Actuator (මේක තමයි monitoring endpoints provide කරන්නේ)
- Micrometer Registry Prometheus (Prometheus support එකට)
- Micrometer Registry Influx (InfluxDB support එකට)
ඔයාගේ pom.xml එක මේ වගේ වෙයි (dependencies ටික විතරක්):
<dependencies>
<dependency>
<groupId>org.springframework.boot</groupId>
<artifactId>spring-boot-starter-web</artifactId>
</dependency>
<dependency>
<groupId>org.springframework.boot</groupId>
<artifactId>spring-boot-starter-actuator</artifactId>
</dependency>
<dependency>
<groupId>io.micrometer</groupId>
<artifactId>micrometer-registry-prometheus</artifactId>
<scope>runtime</scope>
</dependency>
<dependency>
<groupId>io.micrometer</groupId>
<artifactId>micrometer-registry-influx</artifactId>
<scope>runtime</scope>
</dependency>
<dependency>
<groupId>org.springframework.boot</groupId>
<artifactId>spring-boot-starter-test</artifactId>
<scope>test</scope>
</dependency>
</dependencies>දැන් අපි බලමු application.properties එකේ අවශ්ය configurations ටික කරගන්න හැටි.
# Expose all actuator endpoints over web
management.endpoints.web.exposure.include=*
# Enable Prometheus endpoint
management.metrics.export.prometheus.enabled=true
# InfluxDB Configuration
# Make sure InfluxDB is running and a database named 'spring_metrics' exists
management.metrics.export.influx.enabled=true
management.metrics.export.influx.uri=http://localhost:8086
management.metrics.export.influx.db=spring_metrics
management.metrics.export.influx.step=10s # Send metrics every 10 secondsමේ configuration එකෙන් අපි කරන්නේ Actuator endpoints ඔක්කොම expose කරන එක (ඒ කියන්නේ URL එකකින් access කරන්න පුළුවන් කරන එක). ඊට පස්සේ Prometheus සහ InfluxDB export කිරීම් enable කරනවා. InfluxDB වලට URI එකයි, database නමයි, metrics යවන interval එකයි අපි මෙතනදී දීලා තියෙනවා. InfluxDB run කරද්දි spring_metrics කියන database එකක් හදාගන්න අමතක කරන්න එපා. නැත්නම් වැරදි එන්න පුළුවන්.
3. Custom Metrics එකතු කිරීම
දැන් අපේ project එක set කරගෙන ඉවරයි. අපි බලමු කොහොමද අපේ application code එක ඇතුලෙන් custom metrics හදලා Micrometer වලට register කරන්නේ කියලා.
Spring Boot වලදී, අපිට MeterRegistry bean එක @Autowired කරන්න පුළුවන්. මේ MeterRegistry එක තමයි metrics create කරන්න සහ manage කරන්න පාවිච්චි කරන්නේ.
අපි සරල Controller එකක් හදමු, ඒකේ methods call වෙනකොට metrics record වෙන විදියට.
import io.micrometer.core.instrument.Counter;
import io.micrometer.core.instrument.MeterRegistry;
import io.micrometer.core.instrument.Timer;
import org.springframework.web.bind.annotation.GetMapping;
import org.springframework.web.bind.annotation.RequestParam;
import org.springframework.web.bind.annotation.RestController;
import java.util.Random;
import java.util.concurrent.TimeUnit;
@RestController
public class MyMetricsController {
private final Counter helloCounter;
private final Timer processTimer;
private final Random random = new Random();
public MyMetricsController(MeterRegistry registry) {
// Counter: සිදුවීම් ගණන ගණන් කිරීමට
this.helloCounter = Counter.builder("my_app.hello.calls.total")
.description("Total number of calls to the /hello endpoint")
.tag("endpoint", "/hello") // metrics වලට tags එකතු කරන්න පුළුවන්
.register(registry);
// Timer: යම් operation එකකට ගතවන කාලය මැනීමට
this.processTimer = Timer.builder("my_app.process.duration")
.description("Duration of a simulated processing task")
.tag("component", "processor")
.register(registry);
}
@GetMapping("/hello")
public String hello(@RequestParam(defaultValue = "world") String name) {
helloCounter.increment(); // /hello endpoint එකට call එකක් ආවම counter එක වැඩි කරනවා
return "Hello, " + name + "!";
}
@GetMapping("/process")
public String process() {
// Timer එක පාවිච්චි කරලා යම් task එකක කාලය මැනීම
return processTimer.record(() -> {
try {
// Simulate some work taking random time
TimeUnit.MILLISECONDS.sleep(random.nextInt(500) + 50);
} catch (InterruptedException e) {
Thread.currentThread().interrupt();
}
return "Processing complete!";
});
}
// Gauge එකකට උදාහරණයක්
// අපි මෙතන හදන්නේ random number එකක්, නමුත් real world එකේ මේක
// queue size එකක්, active connections ගානක් වගේ එකක් වෙන්න පුළුවන්.
private int someValue = 0;
@GetMapping("/updateGauge")
public String updateGauge() {
someValue = random.nextInt(100); // Gauge එකේ අගය update කරනවා
return "Gauge value updated to: " + someValue;
}
// Constructor එකේ Gauge එක register කරනවා
// Gauge එකක් register කරද්දි, අපි ඒකේ වටිනාකම ලබා දෙන supplier (method reference) එකක් දෙනවා.
// Micrometer වරින් වර මේ supplier එක call කරලා වටිනාකම ලබාගන්නවා.
public MyMetricsController(MeterRegistry registry, Counter helloCounter, Timer processTimer) {
this.helloCounter = helloCounter;
this.processTimer = processTimer;
// Gauge: යම් මොහොතක අගය මැනීමට
// මෙතනදී අපි 'this::getSomeValue' කියන method reference එක දෙනවා.
// Micrometer මේ method එක call කරලා වරින් වර අගය ගන්නවා.
registry.gauge("my_app.random.gauge.value", this, MyMetricsController::getSomeValue);
}
private int getSomeValue() {
return this.someValue;
}
// ... (rest of the code, methods like /hello and /process) ...
}
ඉහත කේතයේදී:
- අපි
MeterRegistryඑක constructor හරහා inject කරගත්තා. Counter.builder()පාවිච්චි කරලා/helloendpoint එකට එන calls ගණන් කරන්නhelloCounterඑකක් හැදුවා.Timer.builder()පාවිච්චි කරලා/processendpoint එකේ processing time එක මනින්නprocessTimerඑකක් හැදුවා.registry.gauge()පාවිච්චි කරලාsomeValueකියන instance variable එකේ අගය track කරන්නGaugeඑකක් හැදුවා. Gauge එකට අපි reference එකක් දෙනවා Micrometer වලට වරින් වර අගය ලබාගන්න පුළුවන් වෙන්න.
මතක තියාගන්න, metrics වලට දෙන නම් (e.g., my_app.hello.calls.total) පැහැදිලි සහ consistency එකක් තියාගන්න. tags කියන්නේ metrics වලට additional metadata එකතු කරන්න පුළුවන් ක්රමයක්. මේවා monitoring dashboards වලදී filter කරන්න, group කරන්න ගොඩක් ප්රයෝජනවත් වෙනවා.
4. Prometheus වෙත Metrics Export කිරීම
දැන් අපි බලමු Prometheus වලට මේ metrics යවන්නේ කොහොමද කියලා. Prometheus කියන්නේ pull-based monitoring system එකක්. ඒ කියන්නේ, Prometheus server එක අපේ application එකේ තියෙන metric endpoint එකකින් දත්ත අදිනවා (scrapes).
අපි කලින් application.properties එකේ මේක enable කරලා තියෙන්නේ:
management.metrics.export.prometheus.enabled=trueඔයාගේ Spring Boot application එක start කරාට පස්සේ, ඔයාට පුළුවන් මේ URL එකට ගිහින් metrics බලන්න: http://localhost:8080/actuator/prometheus (ඔයාගේ application එක 8080 port එකේ දුවනවා නම්). මේකෙන් text format එකෙන් Prometheus scrape කරන්න පුළුවන් metrics ඔක්කොම පෙන්නනවා.
ඔයාගේ custom metrics, වගේම Spring Boot විසින්ම provide කරන JVM metrics, HTTP metrics වගේ දේවලුත් මේකේ දකින්න පුළුවන්.
Prometheus Server එක Configure කරමු
Prometheus server එකට අපේ Spring Boot application එකෙන් metrics scrape කරන්න කියන්න, අපි prometheus.yml configuration file එකට job එකක් එකතු කරන්න ඕනේ.
පහත දැක්වෙන්නේ සරල prometheus.yml file එකක්. ඔයාට පුළුවන් Prometheus download කරලා මේ file එකෙන් run කරන්න.
global:
scrape_interval: 15s # By default, scrape targets every 15 seconds.
evaluation_interval: 15s # Evaluate rules every 15 seconds.
scrape_configs:
- job_name: 'spring-boot-app'
metrics_path: '/actuator/prometheus' # අපේ Spring Boot application එකේ Prometheus endpoint එක
static_configs:
- targets: ['localhost:8080'] # අපේ Spring Boot application එක දුවන address එකමේ configuration එකෙන් Prometheus server එකට කියන්නේ, සෑම තත්පර 15කට වරක්ම localhost:8080/actuator/prometheus කියන endpoint එකෙන් metrics අදින්න කියලා. Prometheus server එක start කරාට පස්සේ (උදා: prometheus --config.file=prometheus.yml), ඔයාට පුළුවන් Prometheus UI එකට (http://localhost:9090) ගිහින් අපේ metrics (e.g., my_app_hello_calls_total, my_app_process_duration_seconds_count) හොයලා බලන්න.
5. InfluxDB වෙත Metrics Export කිරීම
දැන් අපි InfluxDB වලට metrics යවන හැටි බලමු. InfluxDB කියන්නේ push-based monitoring system එකක්. ඒ කියන්නේ, අපේ application එකෙන් metrics InfluxDB server එකට තල්ලු කරනවා (pushes).
අපි කලින් application.properties එකේ මේකත් enable කරලා configure කරලා තියෙන්නේ:
management.metrics.export.influx.enabled=true
management.metrics.export.influx.uri=http://localhost:8086
management.metrics.export.influx.db=spring_metrics
management.metrics.export.influx.step=10sමේකෙන් කියන්නේ සෑම තත්පර 10කට වරක්ම InfluxDB server එකට metrics යවන්න කියලා. ඔයා InfluxDB server එක run කරලා (localhost:8086) spring_metrics කියන database එක හදලා තියෙනවා නම්, application එක start කරපු ගමන් metrics InfluxDB වලට යන්න පටන් ගනීවි.
InfluxDB Set Up කිරීම
InfluxDB Docker වලින් run කරන එක හරිම ලේසියි. මේ command එක පාවිච්චි කරන්න:
docker run -d -p 8086:8086 \n --name influxdb \n influxdb:1.8දැන් InfluxDB CLI එකට connect වෙලා database එක හදමු:
docker exec -it influxdb influx
# InfluxDB CLI එක ඇතුලේ
CREATE DATABASE spring_metrics;
SHOW DATABASES;දැන් ඔයාගේ Spring Boot application එක run කරලා /hello සහ /process endpoints වලට calls කිහිපයක් දීලා බලන්න. ඊට පස්සේ InfluxDB CLI එකේම USE spring_metrics; කියලා database එක select කරලා, SHOW MEASUREMENTS; කියලා දීලා බලන්න metrics ඇවිත්ද කියලා.
ඔයාට my_app_hello_calls_total, jvm_memory_used වගේ measurements දකින්න පුළුවන් වෙයි. Graph කරන්න Grafana වගේ tool එකක් InfluxDB එක්ක පාවිච්චි කරන එක ගොඩක් පහසුයි.
6. Metrics Multiple Backends වෙත යැවීම
මේ වෙනකොට අපි දැක්කා කොහොමද Prometheus සහ InfluxDB කියන backends දෙකම අපේ Spring Boot application එකට එකතු කරන්නේ කියලා. Micrometer වල ලොකුම වාසිය තමයි මේක. අපිට අවශ්ය නම් තව backends (e.g., Datadog, New Relic) එකතු කරන්න පුළුවන්, code එකේ ලොකු වෙනසක් නැතුව.
Spring Boot, CompositeMeterRegistry කියන එක automatic configure කරනවා. ඒ කියන්නේ, ඔයාට විවිධ MeterRegistry implementations (Prometheus, InfluxDB) add කරපු ගමන්, Micrometer ඒ ඔක්කොම එකට එකතු කරලා, ඔයා MeterRegistry එකට record කරන හැම metric එකක්ම ඒ හැම backend එකකටම යවනවා.
මේකෙන් අපිට ලැබෙන වාසි මොනවද?
- Flexibility: විවිධ කණ්ඩායම් වලට ඔවුන්ගේ කැමති monitoring system එක පාවිච්චි කරන්න පුළුවන්.
- Redundancy: එක් monitoring system එකක ප්රශ්නයක් ආවත්, තව එකක දත්ත තියෙනවා.
- Diverse Insights: සමහර monitoring systems ඇතැම් ආකාරයේ දත්ත විශ්ලේෂණයට වඩාත් සුදුසුයි. උදාහරණයක් විදියට, Prometheus alerts වලට හොඳයි, InfluxDB time-series data analysis වලට හොඳයි.
දැන් ඔයාගේ application එක run කරද්දි, /actuator/prometheus endpoint එකෙන් Prometheus scrape කරනවා වගේම, සෑම තත්පර 10කට වරක්ම InfluxDB වලටත් metrics push වෙනවා.
අවසන් වශයෙන්
ඉතින් යාලුවනේ, අද අපි Spring Boot applications වල Micrometer කියන බලගතු library එක පාවිච්චි කරලා, custom metrics හදලා, ඒව Prometheus සහ InfluxDB කියන monitoring systems දෙකටම එකවර යවන හැටි විස්තරාත්මකව ඉගෙන ගත්තා. මේක ඔයාලගේ applications වල health, performance, සහ behavior එක නිරීක්ෂණය කරන්න අත්යාවශ්ය දෙයක් කියලා දැන් ඔයාලට තේරෙනවා ඇති.
Micrometer වල Counter, Timer, සහ Gauge වගේ metrics types පාවිච්චි කරලා, ඔයාට ඕනෑම critical business logic එකක් හෝ system resource එකක් track කරන්න පුළුවන්. ඒ වගේම, Prometheus වල pull-based ක්රමය සහ InfluxDB වල push-based ක්රමය දෙකටම එකම code base එකකින් support කරන්න පුළුවන් වීම Micrometer වල තියෙන ලොකුම වාසියක්.
මේ දැනුම පාවිච්චි කරලා ඔයාලගේ ඊළඟ Spring Boot project එකේ metrics implement කරලා බලන්න. මොකද, හොඳ monitoring එකක් කියන්නේ හොඳ application එකක හදවත වගේ. Application එකක ගැටලුවක් ආවම, මේ metrics තමයි අපේ හොඳම යාළුවා වෙන්නේ.
ඔයාලට මේ ගැන ගැටළු තියෙනවා නම්, මේ ගැන තව ඉගෙන ගන්න කැමති නම්, පහලින් comment එකක් දාන්න. ඔයාලගේ අත්දැකීම් මොනවද කියලත් කියන්න! Tech knowledge සිංහලෙන් බෙදාගන්න එක තමයි අපේ අරමුණ. එහෙනම්, තවත් අලුත් ලිපියකින් හමුවෙමු!